


 LP Agent
AI-powered DeFi automation for Solana liquidity providers
Copy Top LPs Now →
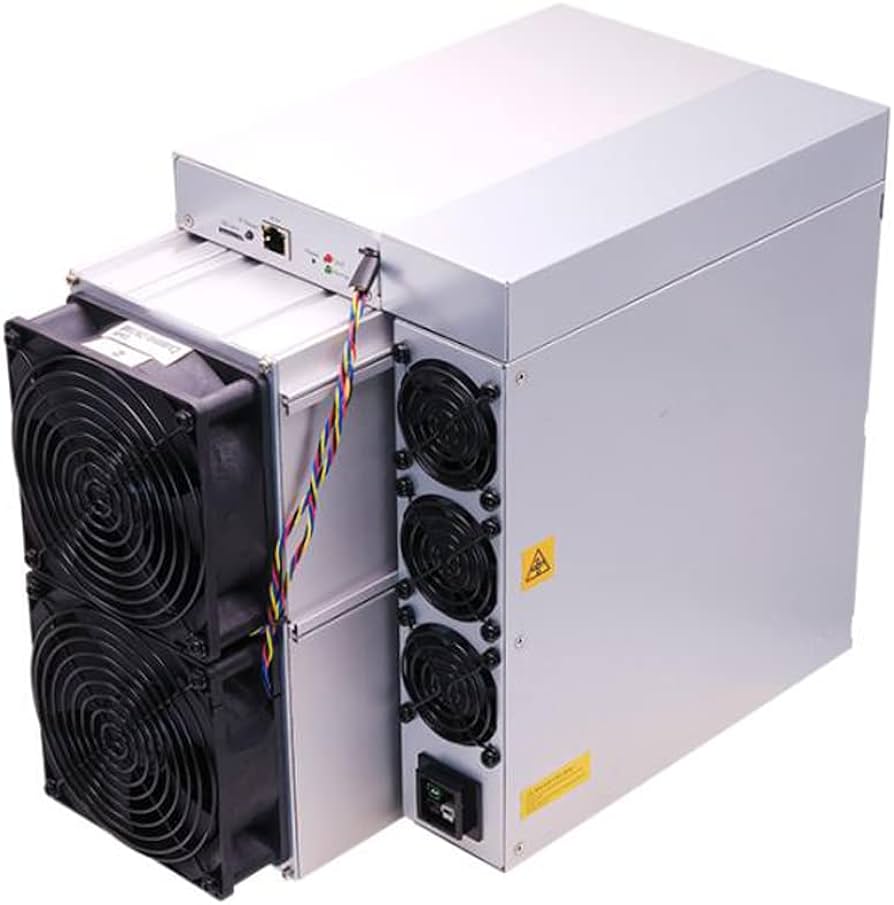
Antminer Z15 Pro rapporte $24.43 par jour en minant Equihash à 840 Kh/s et en consommant 2650.0 W au mur. C'est après déduction de l'électricité à $0.1/kWh — rentable aux tarifs actuels.
Simule la rentabilité du Antminer Z15 Pro sous différentes conditions de réseau et de marché. Ajuste le hashrate réseau Equihash, le prix du coin et l'électricité pour voir l'évolution du profit quotidien avant d'investir dans le matériel à $0.1/kWh.
| Période | /Jour | /Mois |
|---|---|---|
| Revenu | $30.80 | $924.09 |
|
Coût
$0.1/kWh
|
$6.36 | $190.80 |
| Profit | $24.44 | $733.29 |
| Coin | Algorithm | Revenu | Coût | Profit |
|---|---|---|---|---|

ZEC
Zcash
|
Equihash
840Kh · 2650.0W
|
$30.79 | $6.36 | $24.43 |
| Pool | Algos supportés | Frais | |
|---|---|---|---|
|
★
|
Equihash (ZEC) | 1.0% | Visit → |
 LP Agent
| Marché | Algorithme | Profit /jour |
|---|---|---|

NiceHash
seller 24h-weighted avg
|
Equihash
0.00000000048 BTC/H/d
|
$24.44
★
$30.80 revenu · $6.36 coût
Visiter →
|
|
MRR floor
11% rented · matches cheapest seller
|
Equihash
0.00000000027 BTC/H/d
|
$11.30
$17.66 revenu · $6.36 coût
Visiter →
|
|
MRR recent
last 10 rentals · actual clearing price
|
Equihash
0.00000000069 BTC/H/d
|
$37.66
$44.02 revenu · $6.36 coût
Visiter →
|
|
MRR asking
aspirational — seller wish, not matched
|
Equihash
0.00000000068 BTC/H/d
|
$37.61
$43.97 revenu · $6.36 coût
|
| Rigs × Qty | Share | Rev /rig/day | Cost /rig/day | Profit /rig/day | Total profit /day |
|---|---|---|---|---|---|
| — | — | — | — | — | — |
Modélisez l'amortissement, l'électricité et le rendement de la première année pour cet équipement.
Coût matériel récupéré quand la ligne croise zéro.
| Month | Earned (mo) | Cost burned (mo) | Cumulative earned | Cumulative cost | Net | % ROI |
|---|
Basé sur la consommation annuelle et l'intensité carbone.
| Source d'énergie | CO₂e / an |
|---|---|
| Wind | 251.86 kg |
| Nuclear | 274.75 kg |
| Hydroelectric | 549.5 kg |
| Geothermal | 870.05 kg |
| Solar | 1,030.32 kg |
| Biofuels | 5,266.08 kg |
| Gas | 11,219.04 kg |
| Coal | 18,774.72 kg |
Estimations seulement.
At the world-average grid intensity of about 475 g CO₂e/kWh, Antminer Z15 Pro running 24/7 for a year releases about 10,876 kg of carbon dioxide equivalent. Here's what that looks like in everyday terms:
Electricity is not one thing. A kilowatt-hour from a coal plant carries roughly 820 g of CO₂; the same kilowatt-hour from a hydro reservoir carries about 24 g. That's a 34× difference — large enough that Antminer Z15 Pro's annual footprint swings from roughly 18,775 kg on coal-heavy grids down to about 550 kg on hydro-dominated grids. The single biggest lever a miner has on their carbon footprint is choosing where to plug in.
Regions commonly used for low-carbon crypto mining include Quebec and British Columbia (hydro-dominated, typically <50 g CO₂/kWh), Iceland and Norway (geothermal + hydro, often <30 g), Paraguay (Itaipú hydro), and parts of the US Pacific Northwest. Coal-heavy grids — Kazakhstan, Inner Mongolia, Poland, parts of Australia — sit at the opposite end, often above 700 g CO₂/kWh.
Some operators also reduce their net impact by using otherwise-wasted energy: flare gas at oil wells (burning methane that would be vented anyway), curtailed renewables (wind or solar that the grid can't absorb), or behind-the-meter hydro during off-peak hours. These arrangements can drop effective emissions below the local grid average because the energy would have been wasted or flared without the mining load.
Yearly electricity use = rig power (W) × 24 × 365 ÷ 1000. We multiply that by each row's grid intensity in grams CO₂-equivalent per kWh and convert to kilograms. Intensities are representative averages — real emissions depend on your specific utility mix, time of day, and local transmission losses.
It depends almost entirely on where the electricity comes from. A single rig plugged into hydro in Quebec emits less over a year than an average family's two cars in a month. The same rig on a coal-dominated grid can exceed that in a few days. The hardware is the same — the grid is what changes the answer.
Network-wide estimates vary by methodology; the Cambridge Centre for Alternative Finance's Bitcoin Electricity Consumption Index is the most widely cited reference. As of recent reporting, the network's sustainable-energy share has grown as more hashrate migrates to hydro, wind, solar, and stranded-gas sites. This page just estimates a single rig — for the big picture, CCAF's dashboard is the best source.
Not directly. The rig draws the same wattage regardless of which pool it joins or how difficulty trends — so its electricity use, and therefore its emissions, stay constant. Those factors change revenue, not power consumption.
| Période | /Jour | /Mois |
|---|---|---|
| Revenu | $30.80 | $924.09 |
|
Coût
$0.1/kWh
|
$6.36 | $190.80 |
| Profit | $24.44 | $733.29 |
| Coin | Algorithm | Revenu | Coût | Profit |
|---|---|---|---|---|
|
ZEC
Zcash
|
Equihash
840Kh · 2650.0W
|
$30.79 | $6.36 | $24.43 |
| Pool | Algos supportés | Frais | |
|---|---|---|---|
|
★
|
Equihash (ZEC) | 1.0% | Visit → |
| Marché | Algorithme | Profit /jour |
|---|---|---|
|
NiceHash
seller 24h-weighted avg
|
Equihash
0.00000000048 BTC/H/d
|
$24.44
★
$30.80 revenu · $6.36 coût
Visiter →
|
|
MRR floor
11% rented · matches cheapest seller
|
Equihash
0.00000000027 BTC/H/d
|
$11.30
$17.66 revenu · $6.36 coût
Visiter →
|
|
MRR recent
last 10 rentals · actual clearing price
|
Equihash
0.00000000069 BTC/H/d
|
$37.66
$44.02 revenu · $6.36 coût
Visiter →
|
|
MRR asking
aspirational — seller wish, not matched
|
Equihash
0.00000000068 BTC/H/d
|
$37.61
$43.97 revenu · $6.36 coût
|
| Rigs × Qty | Share | Rev /rig/day | Cost /rig/day | Profit /rig/day | Total profit /day |
|---|---|---|---|---|---|
| — | — | — | — | — | — |
Modélisez l'amortissement, l'électricité et le rendement de la première année pour cet équipement.
Coût matériel récupéré quand la ligne croise zéro.
| Month | Earned (mo) | Cost burned (mo) | Cumulative earned | Cumulative cost | Net | % ROI |
|---|
Basé sur la consommation annuelle et l'intensité carbone.
| Source d'énergie | CO₂e / an |
|---|---|
| Wind | 251.86 kg |
| Nuclear | 274.75 kg |
| Hydroelectric | 549.5 kg |
| Geothermal | 870.05 kg |
| Solar | 1,030.32 kg |
| Biofuels | 5,266.08 kg |
| Gas | 11,219.04 kg |
| Coal | 18,774.72 kg |
Estimations seulement.
At the world-average grid intensity of about 475 g CO₂e/kWh, Antminer Z15 Pro running 24/7 for a year releases about 10,876 kg of carbon dioxide equivalent. Here's what that looks like in everyday terms:
Electricity is not one thing. A kilowatt-hour from a coal plant carries roughly 820 g of CO₂; the same kilowatt-hour from a hydro reservoir carries about 24 g. That's a 34× difference — large enough that Antminer Z15 Pro's annual footprint swings from roughly 18,775 kg on coal-heavy grids down to about 550 kg on hydro-dominated grids. The single biggest lever a miner has on their carbon footprint is choosing where to plug in.
Regions commonly used for low-carbon crypto mining include Quebec and British Columbia (hydro-dominated, typically <50 g CO₂/kWh), Iceland and Norway (geothermal + hydro, often <30 g), Paraguay (Itaipú hydro), and parts of the US Pacific Northwest. Coal-heavy grids — Kazakhstan, Inner Mongolia, Poland, parts of Australia — sit at the opposite end, often above 700 g CO₂/kWh.
Some operators also reduce their net impact by using otherwise-wasted energy: flare gas at oil wells (burning methane that would be vented anyway), curtailed renewables (wind or solar that the grid can't absorb), or behind-the-meter hydro during off-peak hours. These arrangements can drop effective emissions below the local grid average because the energy would have been wasted or flared without the mining load.
Yearly electricity use = rig power (W) × 24 × 365 ÷ 1000. We multiply that by each row's grid intensity in grams CO₂-equivalent per kWh and convert to kilograms. Intensities are representative averages — real emissions depend on your specific utility mix, time of day, and local transmission losses.
It depends almost entirely on where the electricity comes from. A single rig plugged into hydro in Quebec emits less over a year than an average family's two cars in a month. The same rig on a coal-dominated grid can exceed that in a few days. The hardware is the same — the grid is what changes the answer.
Network-wide estimates vary by methodology; the Cambridge Centre for Alternative Finance's Bitcoin Electricity Consumption Index is the most widely cited reference. As of recent reporting, the network's sustainable-energy share has grown as more hashrate migrates to hydro, wind, solar, and stranded-gas sites. This page just estimates a single rig — for the big picture, CCAF's dashboard is the best source.
Not directly. The rig draws the same wattage regardless of which pool it joins or how difficulty trends — so its electricity use, and therefore its emissions, stay constant. Those factors change revenue, not power consumption.

