


 LP Agent
AI-powered DeFi automation for Solana liquidity providers
Copy Top LPs Now →
Decred moved to hybrid PoS — Blake (14r) PoW miners no longer earn block rewards. Returns are zero or minimal in 2026.
Active alternatives in the same hardware class
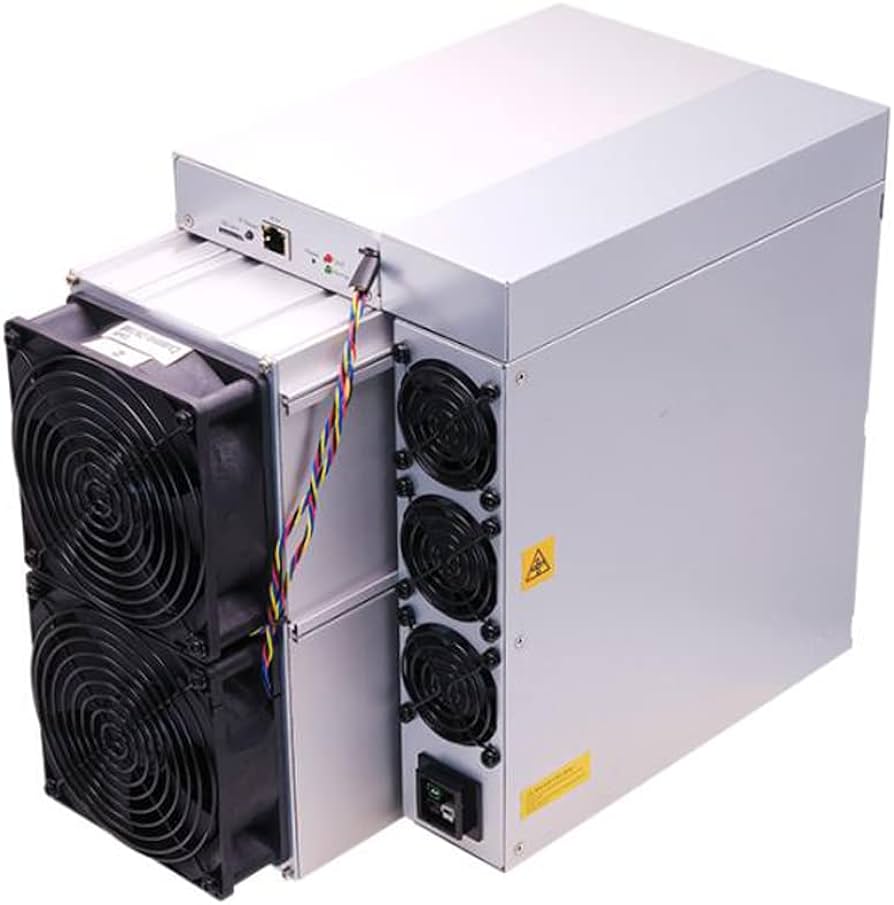
Antminer DR5 目前暂无最新的盈利数据。
在不同网络与市场条件下模拟 Antminer DR5 的盈利。调整 Blake256R14 网络算力、币价和电价,先看清日利润如何变化,再在 $0.1/kWh 下投入硬件。
| 周期 | /日 | /月 |
|---|---|---|
| 收入 | $0.00 | $0.00 |
|
成本
$0.1/kWh
|
$3.86 | $115.80 |
| 利润 | $0.00 | $0.00 |
| Coin | Algorithm | 收入 | 成本 | 利润 |
|---|---|---|---|---|
|
—
|
Blake256R14
35Th · 1610.0W
|
— | $3.86 | — |
 LP Agent
测算此设备的回本周期、电费和首年收益。
曲线穿过零点即回本。之后全是利润。
| Month | Earned (mo) | Cost burned (mo) | Cumulative earned | Cumulative cost | Net | % ROI |
|---|
基于年度耗电量和常见电网的碳强度。
| 能源来源 | CO₂e / 年 |
|---|---|
| Wind | 153.01 kg |
| Nuclear | 166.92 kg |
| Hydroelectric | 333.85 kg |
| Geothermal | 528.6 kg |
| Solar | 625.97 kg |
| Biofuels | 3,199.39 kg |
| Gas | 6,816.1 kg |
| Coal | 11,406.53 kg |
仅为估算 — 实际排放因硬件、冷却和电网而异。
At the world-average grid intensity of about 475 g CO₂e/kWh, Antminer DR5 running 24/7 for a year releases about 6,607 kg of carbon dioxide equivalent. Here's what that looks like in everyday terms:
Electricity is not one thing. A kilowatt-hour from a coal plant carries roughly 820 g of CO₂; the same kilowatt-hour from a hydro reservoir carries about 24 g. That's a 34× difference — large enough that Antminer DR5's annual footprint swings from roughly 11,407 kg on coal-heavy grids down to about 334 kg on hydro-dominated grids. The single biggest lever a miner has on their carbon footprint is choosing where to plug in.
Regions commonly used for low-carbon crypto mining include Quebec and British Columbia (hydro-dominated, typically <50 g CO₂/kWh), Iceland and Norway (geothermal + hydro, often <30 g), Paraguay (Itaipú hydro), and parts of the US Pacific Northwest. Coal-heavy grids — Kazakhstan, Inner Mongolia, Poland, parts of Australia — sit at the opposite end, often above 700 g CO₂/kWh.
Some operators also reduce their net impact by using otherwise-wasted energy: flare gas at oil wells (burning methane that would be vented anyway), curtailed renewables (wind or solar that the grid can't absorb), or behind-the-meter hydro during off-peak hours. These arrangements can drop effective emissions below the local grid average because the energy would have been wasted or flared without the mining load.
Yearly electricity use = rig power (W) × 24 × 365 ÷ 1000. We multiply that by each row's grid intensity in grams CO₂-equivalent per kWh and convert to kilograms. Intensities are representative averages — real emissions depend on your specific utility mix, time of day, and local transmission losses.
It depends almost entirely on where the electricity comes from. A single rig plugged into hydro in Quebec emits less over a year than an average family's two cars in a month. The same rig on a coal-dominated grid can exceed that in a few days. The hardware is the same — the grid is what changes the answer.
Network-wide estimates vary by methodology; the Cambridge Centre for Alternative Finance's Bitcoin Electricity Consumption Index is the most widely cited reference. As of recent reporting, the network's sustainable-energy share has grown as more hashrate migrates to hydro, wind, solar, and stranded-gas sites. This page just estimates a single rig — for the big picture, CCAF's dashboard is the best source.
Not directly. The rig draws the same wattage regardless of which pool it joins or how difficulty trends — so its electricity use, and therefore its emissions, stay constant. Those factors change revenue, not power consumption.
| 周期 | /日 | /月 |
|---|---|---|
| 收入 | $0.00 | $0.00 |
|
成本
$0.1/kWh
|
$3.86 | $115.80 |
| 利润 | $0.00 | $0.00 |
| Coin | Algorithm | 收入 | 成本 | 利润 |
|---|---|---|---|---|
|
—
|
Blake256R14
35Th · 1610.0W
|
— | $3.86 | — |
测算此设备的回本周期、电费和首年收益。
曲线穿过零点即回本。之后全是利润。
| Month | Earned (mo) | Cost burned (mo) | Cumulative earned | Cumulative cost | Net | % ROI |
|---|
基于年度耗电量和常见电网的碳强度。
| 能源来源 | CO₂e / 年 |
|---|---|
| Wind | 153.01 kg |
| Nuclear | 166.92 kg |
| Hydroelectric | 333.85 kg |
| Geothermal | 528.6 kg |
| Solar | 625.97 kg |
| Biofuels | 3,199.39 kg |
| Gas | 6,816.1 kg |
| Coal | 11,406.53 kg |
仅为估算 — 实际排放因硬件、冷却和电网而异。
At the world-average grid intensity of about 475 g CO₂e/kWh, Antminer DR5 running 24/7 for a year releases about 6,607 kg of carbon dioxide equivalent. Here's what that looks like in everyday terms:
Electricity is not one thing. A kilowatt-hour from a coal plant carries roughly 820 g of CO₂; the same kilowatt-hour from a hydro reservoir carries about 24 g. That's a 34× difference — large enough that Antminer DR5's annual footprint swings from roughly 11,407 kg on coal-heavy grids down to about 334 kg on hydro-dominated grids. The single biggest lever a miner has on their carbon footprint is choosing where to plug in.
Regions commonly used for low-carbon crypto mining include Quebec and British Columbia (hydro-dominated, typically <50 g CO₂/kWh), Iceland and Norway (geothermal + hydro, often <30 g), Paraguay (Itaipú hydro), and parts of the US Pacific Northwest. Coal-heavy grids — Kazakhstan, Inner Mongolia, Poland, parts of Australia — sit at the opposite end, often above 700 g CO₂/kWh.
Some operators also reduce their net impact by using otherwise-wasted energy: flare gas at oil wells (burning methane that would be vented anyway), curtailed renewables (wind or solar that the grid can't absorb), or behind-the-meter hydro during off-peak hours. These arrangements can drop effective emissions below the local grid average because the energy would have been wasted or flared without the mining load.
Yearly electricity use = rig power (W) × 24 × 365 ÷ 1000. We multiply that by each row's grid intensity in grams CO₂-equivalent per kWh and convert to kilograms. Intensities are representative averages — real emissions depend on your specific utility mix, time of day, and local transmission losses.
It depends almost entirely on where the electricity comes from. A single rig plugged into hydro in Quebec emits less over a year than an average family's two cars in a month. The same rig on a coal-dominated grid can exceed that in a few days. The hardware is the same — the grid is what changes the answer.
Network-wide estimates vary by methodology; the Cambridge Centre for Alternative Finance's Bitcoin Electricity Consumption Index is the most widely cited reference. As of recent reporting, the network's sustainable-energy share has grown as more hashrate migrates to hydro, wind, solar, and stranded-gas sites. This page just estimates a single rig — for the big picture, CCAF's dashboard is the best source.
Not directly. The rig draws the same wattage regardless of which pool it joins or how difficulty trends — so its electricity use, and therefore its emissions, stay constant. Those factors change revenue, not power consumption.
