


 LP Agent
AI-powered DeFi automation for Solana liquidity providers
Copy Top LPs Now →
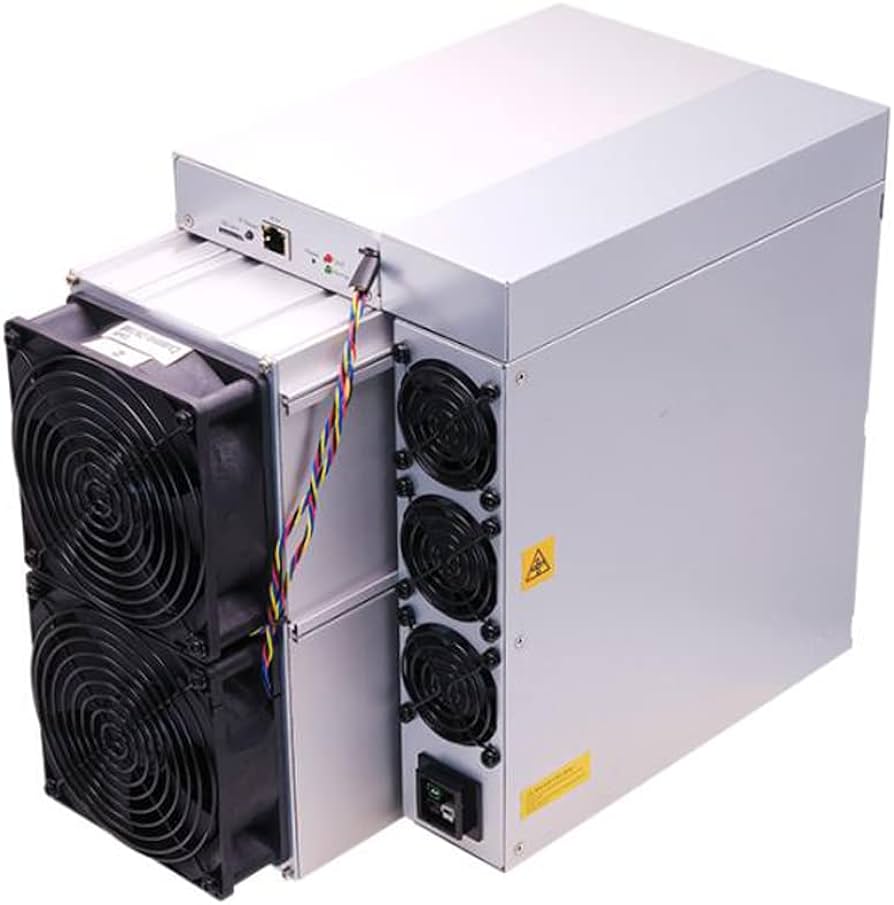
Antminer S19 XP 每天净亏 $2.11 挖 Sha256 算力 140 Th/s 功耗 3010.0 W. 这是在扣除 $0.1/kWh 电费后的结果 — 按当前行情暂未回本。
Antminer S19 XP 在 Vast.ai、RunPod、io.net 及其他 AI 算力市场的实时 GPU 租赁价格。每一行展示扣除平台手续费后的主机日净收益、当前利用率,以及在 $0.1/kWh 电价下的回本期。
| 周期 | /日 | /月 |
|---|---|---|
| 收入 | $7.37 | $221.25 |
|
成本
$0.1/kWh
|
$7.22 | $216.60 |
| 利润 | $0.15 | $4.53 |
| Coin | Algorithm | 收入 | 成本 | 利润 |
|---|---|---|---|---|

BTC
Bitcoin
|
Sha256
140Th · 3010.0W
|
$5.11 | $7.22 | $-2.11 |
| 矿池 | 支持算法 | 费率 | |
|---|---|---|---|
|
★
|
Sha256 (BTC) | 1.0% | Visit → |
 LP Agent
暂无规格。
| 市场 | 算法 | 利润 /天 |
|---|---|---|

NiceHash
seller 24h-weighted avg
|
Sha256
0.00000050781 BTC/T/d
|
$-1.80
$5.42 收入 · $7.22 成本
访问 →
|
|
MRR floor
19% rented · matches cheapest seller
|
Sha256
0.00000068159 BTC/T/d
|
$0.06
★
$7.28 收入 · $7.22 成本
访问 →
|
|
MRR recent
last 10 rentals · actual clearing price
|
Sha256
0.00000077330 BTC/T/d
|
$1.04
★
$8.26 收入 · $7.22 成本
访问 →
|
|
MRR asking
aspirational — seller wish, not matched
|
Sha256
0.00000069430 BTC/T/d
|
$0.20
$7.42 收入 · $7.22 成本
|
| Rigs × Qty | Share | Rev /rig/day | Cost /rig/day | Profit /rig/day | Total profit /day |
|---|---|---|---|---|---|
| — | — | — | — | — | — |
测算此设备的回本周期、电费和首年收益。
曲线穿过零点即回本。之后全是利润。
| Month | Earned (mo) | Cost burned (mo) | Cumulative earned | Cumulative cost | Net | % ROI |
|---|
基于年度耗电量和常见电网的碳强度。
| 能源来源 | CO₂e / 年 |
|---|---|
| Wind | 286.07 kg |
| Nuclear | 312.08 kg |
| Hydroelectric | 624.15 kg |
| Geothermal | 988.24 kg |
| Solar | 1,170.29 kg |
| Biofuels | 5,981.47 kg |
| Gas | 12,743.14 kg |
| Coal | 21,325.25 kg |
仅为估算 — 实际排放因硬件、冷却和电网而异。
At the world-average grid intensity of about 475 g CO₂e/kWh, Antminer S19 XP running 24/7 for a year releases about 12,353 kg of carbon dioxide equivalent. Here's what that looks like in everyday terms:
Electricity is not one thing. A kilowatt-hour from a coal plant carries roughly 820 g of CO₂; the same kilowatt-hour from a hydro reservoir carries about 24 g. That's a 34× difference — large enough that Antminer S19 XP's annual footprint swings from roughly 21,325 kg on coal-heavy grids down to about 624 kg on hydro-dominated grids. The single biggest lever a miner has on their carbon footprint is choosing where to plug in.
Regions commonly used for low-carbon crypto mining include Quebec and British Columbia (hydro-dominated, typically <50 g CO₂/kWh), Iceland and Norway (geothermal + hydro, often <30 g), Paraguay (Itaipú hydro), and parts of the US Pacific Northwest. Coal-heavy grids — Kazakhstan, Inner Mongolia, Poland, parts of Australia — sit at the opposite end, often above 700 g CO₂/kWh.
Some operators also reduce their net impact by using otherwise-wasted energy: flare gas at oil wells (burning methane that would be vented anyway), curtailed renewables (wind or solar that the grid can't absorb), or behind-the-meter hydro during off-peak hours. These arrangements can drop effective emissions below the local grid average because the energy would have been wasted or flared without the mining load.
Yearly electricity use = rig power (W) × 24 × 365 ÷ 1000. We multiply that by each row's grid intensity in grams CO₂-equivalent per kWh and convert to kilograms. Intensities are representative averages — real emissions depend on your specific utility mix, time of day, and local transmission losses.
It depends almost entirely on where the electricity comes from. A single rig plugged into hydro in Quebec emits less over a year than an average family's two cars in a month. The same rig on a coal-dominated grid can exceed that in a few days. The hardware is the same — the grid is what changes the answer.
Network-wide estimates vary by methodology; the Cambridge Centre for Alternative Finance's Bitcoin Electricity Consumption Index is the most widely cited reference. As of recent reporting, the network's sustainable-energy share has grown as more hashrate migrates to hydro, wind, solar, and stranded-gas sites. This page just estimates a single rig — for the big picture, CCAF's dashboard is the best source.
Not directly. The rig draws the same wattage regardless of which pool it joins or how difficulty trends — so its electricity use, and therefore its emissions, stay constant. Those factors change revenue, not power consumption.


| 周期 | /日 | /月 |
|---|---|---|
| 收入 | $7.37 | $221.25 |
|
成本
$0.1/kWh
|
$7.22 | $216.60 |
| 利润 | $0.15 | $4.53 |
| Coin | Algorithm | 收入 | 成本 | 利润 |
|---|---|---|---|---|
|
BTC
Bitcoin
|
Sha256
140Th · 3010.0W
|
$5.11 | $7.22 | $-2.11 |
| 矿池 | 支持算法 | 费率 | |
|---|---|---|---|
|
★
|
Sha256 (BTC) | 1.0% | Visit → |
暂无规格。
| 市场 | 算法 | 利润 /天 |
|---|---|---|
|
NiceHash
seller 24h-weighted avg
|
Sha256
0.00000050781 BTC/T/d
|
$-1.80
$5.42 收入 · $7.22 成本
访问 →
|
|
MRR floor
19% rented · matches cheapest seller
|
Sha256
0.00000068159 BTC/T/d
|
$0.06
★
$7.28 收入 · $7.22 成本
访问 →
|
|
MRR recent
last 10 rentals · actual clearing price
|
Sha256
0.00000077330 BTC/T/d
|
$1.04
★
$8.26 收入 · $7.22 成本
访问 →
|
|
MRR asking
aspirational — seller wish, not matched
|
Sha256
0.00000069430 BTC/T/d
|
$0.20
$7.42 收入 · $7.22 成本
|
| Rigs × Qty | Share | Rev /rig/day | Cost /rig/day | Profit /rig/day | Total profit /day |
|---|---|---|---|---|---|
| — | — | — | — | — | — |
测算此设备的回本周期、电费和首年收益。
曲线穿过零点即回本。之后全是利润。
| Month | Earned (mo) | Cost burned (mo) | Cumulative earned | Cumulative cost | Net | % ROI |
|---|
基于年度耗电量和常见电网的碳强度。
| 能源来源 | CO₂e / 年 |
|---|---|
| Wind | 286.07 kg |
| Nuclear | 312.08 kg |
| Hydroelectric | 624.15 kg |
| Geothermal | 988.24 kg |
| Solar | 1,170.29 kg |
| Biofuels | 5,981.47 kg |
| Gas | 12,743.14 kg |
| Coal | 21,325.25 kg |
仅为估算 — 实际排放因硬件、冷却和电网而异。
At the world-average grid intensity of about 475 g CO₂e/kWh, Antminer S19 XP running 24/7 for a year releases about 12,353 kg of carbon dioxide equivalent. Here's what that looks like in everyday terms:
Electricity is not one thing. A kilowatt-hour from a coal plant carries roughly 820 g of CO₂; the same kilowatt-hour from a hydro reservoir carries about 24 g. That's a 34× difference — large enough that Antminer S19 XP's annual footprint swings from roughly 21,325 kg on coal-heavy grids down to about 624 kg on hydro-dominated grids. The single biggest lever a miner has on their carbon footprint is choosing where to plug in.
Regions commonly used for low-carbon crypto mining include Quebec and British Columbia (hydro-dominated, typically <50 g CO₂/kWh), Iceland and Norway (geothermal + hydro, often <30 g), Paraguay (Itaipú hydro), and parts of the US Pacific Northwest. Coal-heavy grids — Kazakhstan, Inner Mongolia, Poland, parts of Australia — sit at the opposite end, often above 700 g CO₂/kWh.
Some operators also reduce their net impact by using otherwise-wasted energy: flare gas at oil wells (burning methane that would be vented anyway), curtailed renewables (wind or solar that the grid can't absorb), or behind-the-meter hydro during off-peak hours. These arrangements can drop effective emissions below the local grid average because the energy would have been wasted or flared without the mining load.
Yearly electricity use = rig power (W) × 24 × 365 ÷ 1000. We multiply that by each row's grid intensity in grams CO₂-equivalent per kWh and convert to kilograms. Intensities are representative averages — real emissions depend on your specific utility mix, time of day, and local transmission losses.
It depends almost entirely on where the electricity comes from. A single rig plugged into hydro in Quebec emits less over a year than an average family's two cars in a month. The same rig on a coal-dominated grid can exceed that in a few days. The hardware is the same — the grid is what changes the answer.
Network-wide estimates vary by methodology; the Cambridge Centre for Alternative Finance's Bitcoin Electricity Consumption Index is the most widely cited reference. As of recent reporting, the network's sustainable-energy share has grown as more hashrate migrates to hydro, wind, solar, and stranded-gas sites. This page just estimates a single rig — for the big picture, CCAF's dashboard is the best source.
Not directly. The rig draws the same wattage regardless of which pool it joins or how difficulty trends — so its electricity use, and therefore its emissions, stay constant. Those factors change revenue, not power consumption.