


 LP Agent
AI-powered DeFi automation for Solana liquidity providers
Copy Top LPs Now →
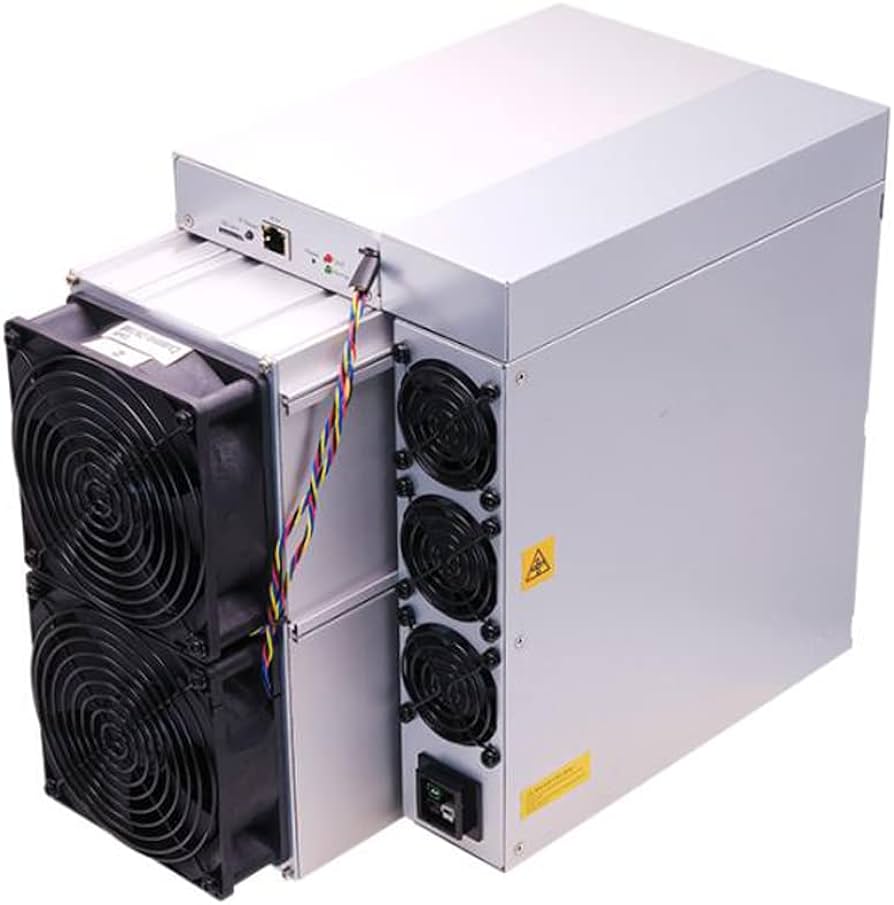
Antminer K5 no tiene actualmente datos de rentabilidad recientes.
| Período | /Día | /Mes |
|---|---|---|
| Ingresos | $0.10 | $2.87 |
|
Costo
$0.1/kWh
|
$3.79 | $113.70 |
| Ganancia | $-3.70 | $-110.89 |
| Coin | Algorithm | Ingresos | Costo | Ganancia |
|---|---|---|---|---|

CKB
Nervos
|
Eaglesong
1.13Th · 1580.0W
|
— | $3.79 | — |
| Pool | Algoritmos soportados | Comisión | |
|---|---|---|---|
|
★
|
Eaglesong (CKB) | 1.0% | Visit → |
 LP Agent
| Mercado | Algoritmo | Beneficio /día |
|---|---|---|

NiceHash
seller 24h-weighted avg
|
Eaglesong
0.00000000068 BTC/G/d
|
$-3.73
$0.06 ingresos · $3.79 costo
Visitar →
|
|
MRR floor
0% rented · matches cheapest seller
|
Eaglesong
0.00000000111 BTC/G/d
|
$-3.69
★
$0.10 ingresos · $3.79 costo
Visitar →
|
|
MRR recent
last 10 rentals · actual clearing price
|
Eaglesong
0.00000000192 BTC/G/d
|
$-3.62
★
$0.17 ingresos · $3.79 costo
Visitar →
|
|
MRR asking
aspirational — seller wish, not matched
|
Eaglesong
0.00000000230 BTC/G/d
|
$-3.59
$0.20 ingresos · $3.79 costo
|
| Rigs × Qty | Share | Rev /rig/day | Cost /rig/day | Profit /rig/day | Total profit /day |
|---|---|---|---|---|---|
| — | — | — | — | — | — |
Modela la recuperación de la inversión, el coste eléctrico y la rentabilidad del primer año para este equipo.
Hardware recuperado cuando la línea cruza cero. Después, todo ganancia.
| Month | Earned (mo) | Cost burned (mo) | Cumulative earned | Cumulative cost | Net | % ROI |
|---|
Basado en el consumo eléctrico anual y la intensidad de carbono de redes comunes.
| Fuente de energía | CO₂e / año |
|---|---|
| Wind | 150.16 kg |
| Nuclear | 163.81 kg |
| Hydroelectric | 327.63 kg |
| Geothermal | 518.75 kg |
| Solar | 614.3 kg |
| Biofuels | 3,139.78 kg |
| Gas | 6,689.09 kg |
| Coal | 11,193.98 kg |
Solo estimaciones — las emisiones reales varían.
At the world-average grid intensity of about 475 g CO₂e/kWh, Antminer K5 running 24/7 for a year releases about 6,484 kg of carbon dioxide equivalent. Here's what that looks like in everyday terms:
Electricity is not one thing. A kilowatt-hour from a coal plant carries roughly 820 g of CO₂; the same kilowatt-hour from a hydro reservoir carries about 24 g. That's a 34× difference — large enough that Antminer K5's annual footprint swings from roughly 11,194 kg on coal-heavy grids down to about 328 kg on hydro-dominated grids. The single biggest lever a miner has on their carbon footprint is choosing where to plug in.
Regions commonly used for low-carbon crypto mining include Quebec and British Columbia (hydro-dominated, typically <50 g CO₂/kWh), Iceland and Norway (geothermal + hydro, often <30 g), Paraguay (Itaipú hydro), and parts of the US Pacific Northwest. Coal-heavy grids — Kazakhstan, Inner Mongolia, Poland, parts of Australia — sit at the opposite end, often above 700 g CO₂/kWh.
Some operators also reduce their net impact by using otherwise-wasted energy: flare gas at oil wells (burning methane that would be vented anyway), curtailed renewables (wind or solar that the grid can't absorb), or behind-the-meter hydro during off-peak hours. These arrangements can drop effective emissions below the local grid average because the energy would have been wasted or flared without the mining load.
Yearly electricity use = rig power (W) × 24 × 365 ÷ 1000. We multiply that by each row's grid intensity in grams CO₂-equivalent per kWh and convert to kilograms. Intensities are representative averages — real emissions depend on your specific utility mix, time of day, and local transmission losses.
It depends almost entirely on where the electricity comes from. A single rig plugged into hydro in Quebec emits less over a year than an average family's two cars in a month. The same rig on a coal-dominated grid can exceed that in a few days. The hardware is the same — the grid is what changes the answer.
Network-wide estimates vary by methodology; the Cambridge Centre for Alternative Finance's Bitcoin Electricity Consumption Index is the most widely cited reference. As of recent reporting, the network's sustainable-energy share has grown as more hashrate migrates to hydro, wind, solar, and stranded-gas sites. This page just estimates a single rig — for the big picture, CCAF's dashboard is the best source.
Not directly. The rig draws the same wattage regardless of which pool it joins or how difficulty trends — so its electricity use, and therefore its emissions, stay constant. Those factors change revenue, not power consumption.
| Período | /Día | /Mes |
|---|---|---|
| Ingresos | $0.10 | $2.87 |
|
Costo
$0.1/kWh
|
$3.79 | $113.70 |
| Ganancia | $-3.70 | $-110.89 |
| Coin | Algorithm | Ingresos | Costo | Ganancia |
|---|---|---|---|---|
|
CKB
Nervos
|
Eaglesong
1.13Th · 1580.0W
|
— | $3.79 | — |
| Pool | Algoritmos soportados | Comisión | |
|---|---|---|---|
|
★
|
Eaglesong (CKB) | 1.0% | Visit → |
| Mercado | Algoritmo | Beneficio /día |
|---|---|---|
|
NiceHash
seller 24h-weighted avg
|
Eaglesong
0.00000000068 BTC/G/d
|
$-3.73
$0.06 ingresos · $3.79 costo
Visitar →
|
|
MRR floor
0% rented · matches cheapest seller
|
Eaglesong
0.00000000111 BTC/G/d
|
$-3.69
★
$0.10 ingresos · $3.79 costo
Visitar →
|
|
MRR recent
last 10 rentals · actual clearing price
|
Eaglesong
0.00000000192 BTC/G/d
|
$-3.62
★
$0.17 ingresos · $3.79 costo
Visitar →
|
|
MRR asking
aspirational — seller wish, not matched
|
Eaglesong
0.00000000230 BTC/G/d
|
$-3.59
$0.20 ingresos · $3.79 costo
|
| Rigs × Qty | Share | Rev /rig/day | Cost /rig/day | Profit /rig/day | Total profit /day |
|---|---|---|---|---|---|
| — | — | — | — | — | — |
Modela la recuperación de la inversión, el coste eléctrico y la rentabilidad del primer año para este equipo.
Hardware recuperado cuando la línea cruza cero. Después, todo ganancia.
| Month | Earned (mo) | Cost burned (mo) | Cumulative earned | Cumulative cost | Net | % ROI |
|---|
Basado en el consumo eléctrico anual y la intensidad de carbono de redes comunes.
| Fuente de energía | CO₂e / año |
|---|---|
| Wind | 150.16 kg |
| Nuclear | 163.81 kg |
| Hydroelectric | 327.63 kg |
| Geothermal | 518.75 kg |
| Solar | 614.3 kg |
| Biofuels | 3,139.78 kg |
| Gas | 6,689.09 kg |
| Coal | 11,193.98 kg |
Solo estimaciones — las emisiones reales varían.
At the world-average grid intensity of about 475 g CO₂e/kWh, Antminer K5 running 24/7 for a year releases about 6,484 kg of carbon dioxide equivalent. Here's what that looks like in everyday terms:
Electricity is not one thing. A kilowatt-hour from a coal plant carries roughly 820 g of CO₂; the same kilowatt-hour from a hydro reservoir carries about 24 g. That's a 34× difference — large enough that Antminer K5's annual footprint swings from roughly 11,194 kg on coal-heavy grids down to about 328 kg on hydro-dominated grids. The single biggest lever a miner has on their carbon footprint is choosing where to plug in.
Regions commonly used for low-carbon crypto mining include Quebec and British Columbia (hydro-dominated, typically <50 g CO₂/kWh), Iceland and Norway (geothermal + hydro, often <30 g), Paraguay (Itaipú hydro), and parts of the US Pacific Northwest. Coal-heavy grids — Kazakhstan, Inner Mongolia, Poland, parts of Australia — sit at the opposite end, often above 700 g CO₂/kWh.
Some operators also reduce their net impact by using otherwise-wasted energy: flare gas at oil wells (burning methane that would be vented anyway), curtailed renewables (wind or solar that the grid can't absorb), or behind-the-meter hydro during off-peak hours. These arrangements can drop effective emissions below the local grid average because the energy would have been wasted or flared without the mining load.
Yearly electricity use = rig power (W) × 24 × 365 ÷ 1000. We multiply that by each row's grid intensity in grams CO₂-equivalent per kWh and convert to kilograms. Intensities are representative averages — real emissions depend on your specific utility mix, time of day, and local transmission losses.
It depends almost entirely on where the electricity comes from. A single rig plugged into hydro in Quebec emits less over a year than an average family's two cars in a month. The same rig on a coal-dominated grid can exceed that in a few days. The hardware is the same — the grid is what changes the answer.
Network-wide estimates vary by methodology; the Cambridge Centre for Alternative Finance's Bitcoin Electricity Consumption Index is the most widely cited reference. As of recent reporting, the network's sustainable-energy share has grown as more hashrate migrates to hydro, wind, solar, and stranded-gas sites. This page just estimates a single rig — for the big picture, CCAF's dashboard is the best source.
Not directly. The rig draws the same wattage regardless of which pool it joins or how difficulty trends — so its electricity use, and therefore its emissions, stay constant. Those factors change revenue, not power consumption.

